
|
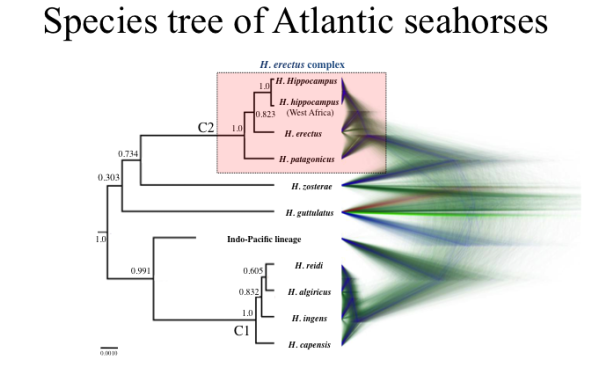
Figures below represent the relationship and evolution of Atlantic seahorse species based on a dataset of mitochondrial DNA and five nuclear loci per species (Boehm et al. 2013).
|
Species tree of the "Hippocampus erectus complex" and all other Atlantic seahorses. Left: 50% majority-rule tree representing the probability of a given gene tree evolving within the branches of a species tree, generated in *beast. Right: 335 most probable topologies visualized in DensiTree to illustrate the statistical uncertainty of our species tree estimation. Greater topological agreement shows a higher density of trees, whereas uncertainty in the height and distribution of nodes are represented by increased transparency.
J.T. Boehm |
|
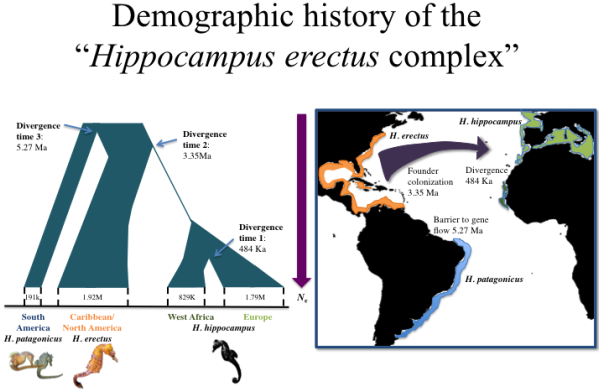
Most probable model-based hypothesis representing the demographic history of the "Hippocampus erectus complex". 386 individuals were collected from the coastal Atlantic (orange, green, blue). (a) Tree illustration reconstructed from parameter values based on the mode of the posterior probabilities estimated from 1 million simulated data sets using an approximate Bayesian computation (ABC) approach. Numerical values of effective population size (Ne) correspond to thousands (k) or millions (M) of individuals per population. (b) Visual representation of demographic inference.
|
