
Two examples of DNA barcoding studies:
|
Diet analysis of five coral reef predators: Conducted in collaboration with the Moorea BIOCODE Project (modified from Leray et al. 2012). For more information on this unique "whole ecosystem" barcoding initiative see: mooreabiocode.org
|
U.S. dried seahorse trade and DNA barcoding as a teaching tool for wildlife forensics: We compared two primary end-markets: 1) traditional Chinese medicine (TCM), and 2) Internet and coastal curio retailers (ICR) (Boehm et al. in review: See "Publications") J.T. Boehm DNA Barcoding
|
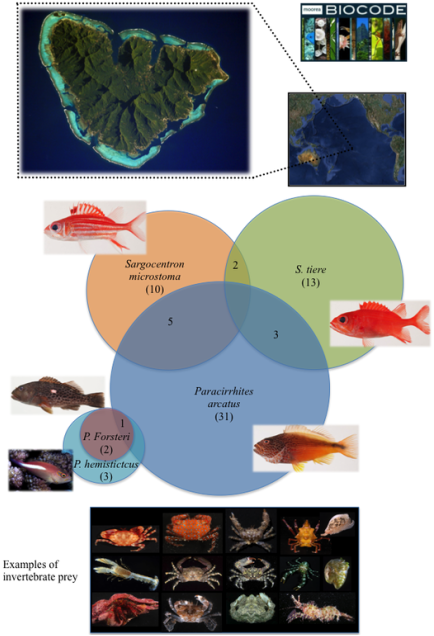
Above: Venn diagram illustrating the overlap of prey species consumed by predator fish species. Circle sizes are proportional to the total number of prey species consumed by each predator (parentheses), and overlap area between circles is proportional to the number of shared prey species.
|
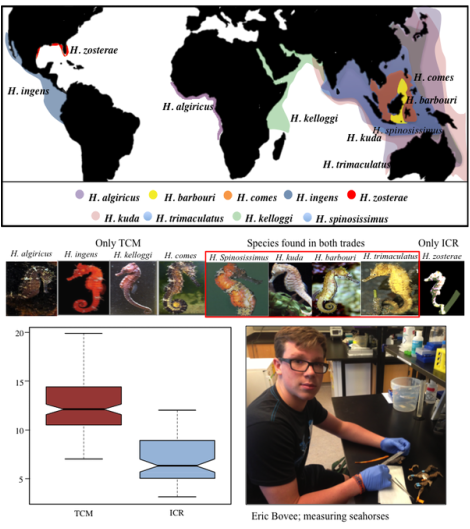
Above: Distribution map of seahorses identified in our study. Of over 500 individuals collected, nine species were identified. Eight were found in the TCM trade, and five in the ICR trade. 86.5% of TCM samples were composed of H. trimaculatus, H. spinosissimus and H. ingens. In contrast, 90.8% of ICR specimens were composed of H. kuda and H. zosterae. Excluding the dwarf seahorse H. zosterae, 94.5% of IRC samples were <10-cm (boxplot). 10 cm is the CITES recommended size limit for sustainable harvest. This suggests that most ICR samples are collected as a result of non-discriminatory bycatch.
My mentee, Eric Bovee was awarded First Place at the annual Urban Barcoding Program competition held at the American Museum of Natural History. Learn more about Eric's work at the UPB website. |
